
Acknowledgment
Because I am grateful to the Russian company, Yandex, for allowing me to have freedom of expression allowing me to even cuss on the zen site, is liberating.
So today I decided to do a study about something exclusively Russian (instead of my American experience or happenings).
This article will focus on a virus that has hit the world, but I will present you with real data that probably not many people have had the honor to see. This data will focus only on Russian data.
If you're interested in reading my MUCH more complete article (which records real-time statistical events, as in my personal diary relating to weekly news and other events related to the new virus), my non-https covid accounting is:
* However, all this is in English, because when I tried to create pages in Russian, my host and Google fined me for "strange characters in my code". Somehow the Russian URL got weird with the numbers, and in any case, half a dozen pages had to be deleted (but they are still stored in my personal archives).
Enough already!
This article is dedicated to the known data on Covid in Russia and is presented for your consideration.
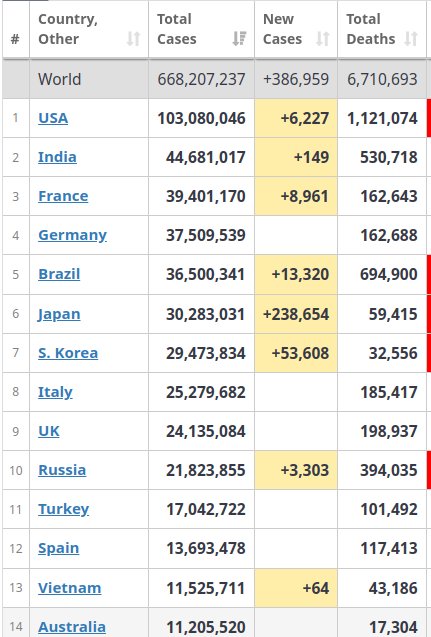
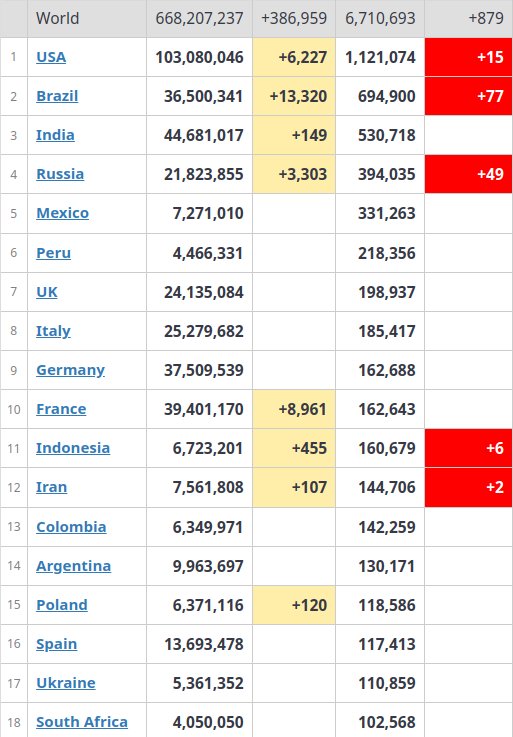
Take a look at the first chart, this is world data. It is important to see this so that you can determine where Russia ranks in this data. Currently, as of this day, Russia ranks 4th in terms of the number of deaths from the virus (my country, unfortunately, ranks 1st, so don't be discouraged).
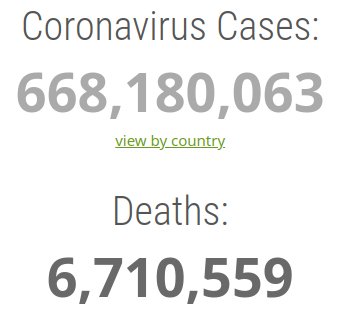
So, as the figures above show, more than 668 million people have been infected with the Covid virus worldwide. Of this total, more than 6 million people have died as a result of the Covid virus.
But before I dump all the doom and gloom on any of you, let me give you some good news. The good news is that Russia appears to be experiencing a dramatic decline in covid-related deaths, which began around January of 2022.
Russian deaths
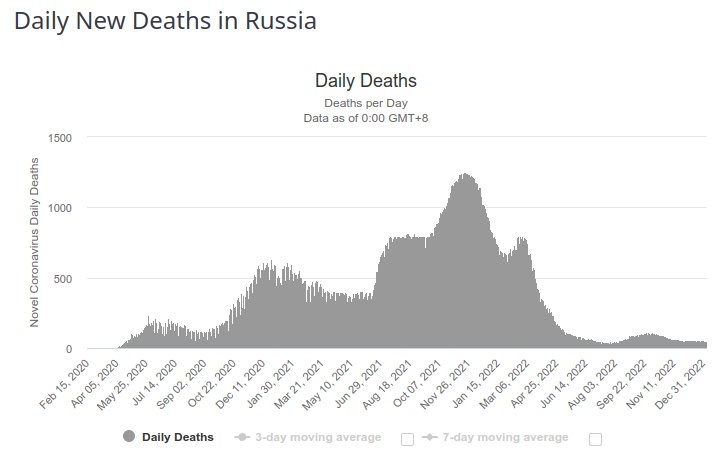
I would like to point out one thing that has become painfully obvious. What was actually a straw for displaying data for an individual day turned into a large black blob on the screen. This is because the data is truncated, because now much more data has accumulated over a longer period of time. Ideally, the graph above 4 would be much wider to better represent daily metrics (as it was when we had data for just a few months. However, the only way to achieve this without truncation would be if we were allowed to scroll left and right to show a much wider graph (I haven't figured out how to do this yet).
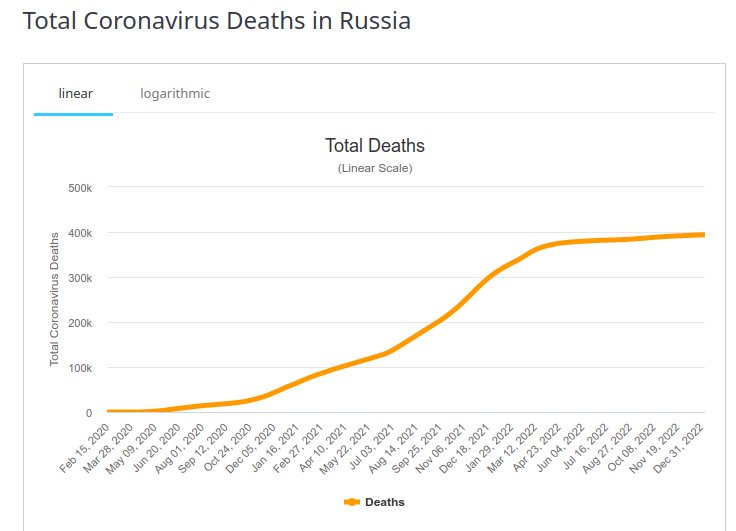
However, collectively, that only applies to those who died due to this year.Due to the coronavirus, Russia is not yet out of the water, as shown in the line graph below.
Cumulative mortality in Russia on a linear scale
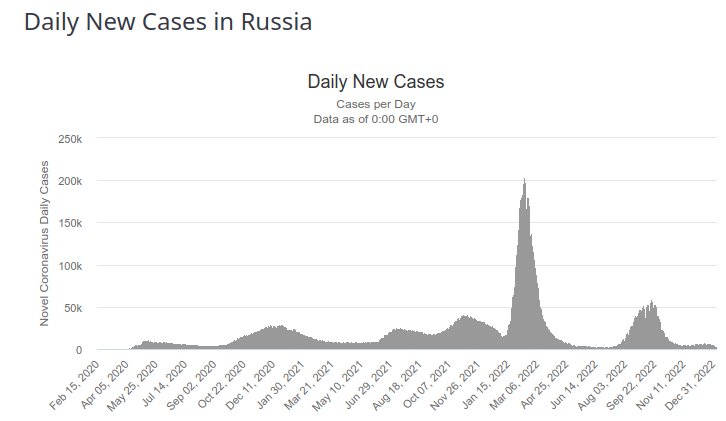
The following graph shows ACTIVE CASES that show Russia's worst interaction with the virus, occurring around the end of 2021-beginning of 2022.
ACTIVE CASES
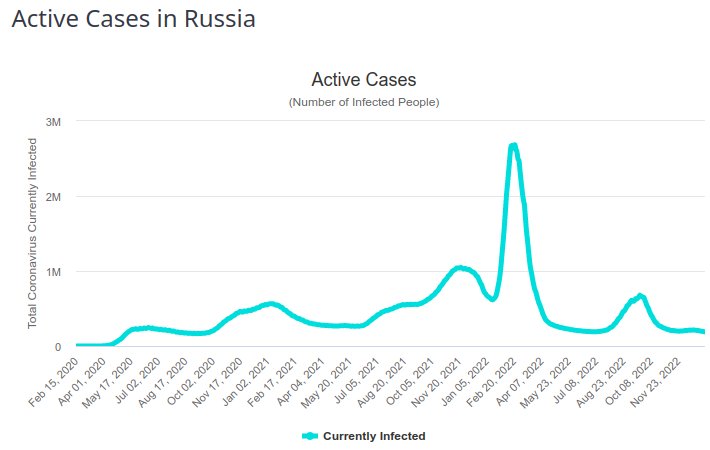
However, the above data can be explained by the influx of new cases during the specified period. The graph below shows the player's choice of an unsuccessful period for winning, which falls mainly at the beginning of 2022.
Daily New cases
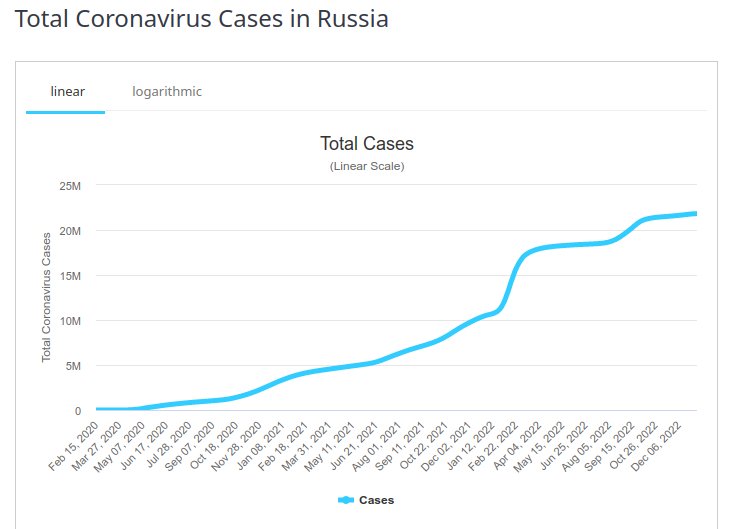
Don't let the following graph confuse you, the coronavirus isn't growing in Russia, but cumulative cases are shown.
Total number of cases of infection in Russia
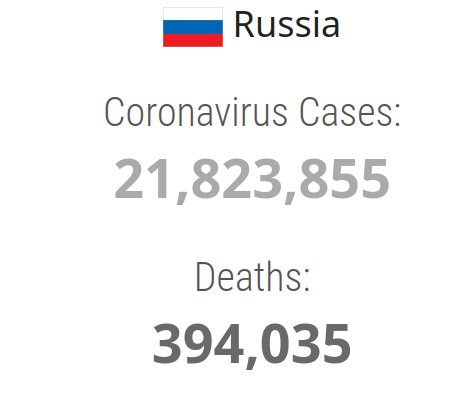
So, as shown below, there are more than 21 million infected people in Russia with more than 394 thousand deaths.
The ratio of infections and deaths in Russia.
Summing up, we can say that Russia ranks 10th in terms of the number of infections, but 4th in terms of mortality.
I'll just post the last two graphs, which show that the first one is organized by country based on the number of infections, and the second and last graph is organized by country based on the number of DEATHS.
Organized by order of deaths
So I hope I cheered someone up today. Smile (this may well be your last smile).

Visit me at the only social site on the planet that will host me!